Instructions On How to Write IELTS Writing Task 1

The following article will summarize all the necessary knowledge about writing Practice Writing Task 1 according to each type of article with sample articles for your reference. For those of you who have studied & learned about the type of Task 1 in IELTS Writing, it will be easier for you to understand with this article. Particularly for those of you who have not studied, the article can be long and detailed; you should read carefully to be able to understand Instructions On How to Write IELTS Writing Task 1.
I. Sentence Structures in IELTS Writing Task 1
1. Sentence structure for a chart with change, trend
Simple Sentence
- There + be + (a/an) + adj + noun + in + noun/ noun phrase + time phrase
E.g:
There was a sharp increase in the number of passengers from 6 A.M to 8 A.M.
- Noun/ noun phrase + verb + (adv) + time phrase
E.g:
The number of passengers increased sharply from 6 A.M to 8 A.M.
Noun/ noun phrase* + see/witness/experience + (a/an) + adj + noun + time phrase
E.g:
The number of passengers witnessed a sharp increase from 6 A.M to 8 A.M.
*Can replace Noun/Noun phrase with Time or Place
- Time (month, year, period…)/ Place (city, country,…) + see/witness/experience + (a/an) + adj + noun + in + noun/noun phrase + …
E.g:
– The period from 6 A.M to 8 A.M saw a sharp increase in the number of passengers.
– London Underground Station saw a sharp increase in the number of passengers from 6 A.M to 8 A.M.
Complex Sentence – Complex Sentence:
- Clause + before/after + V-ing (when having the same subject) / + clause (when not having the same subject)
E.g:
– The number of passengers witnessed a sharp increase from 6 a.m. to 8 a.m. before falling considerably.
– After increasing sharply from 6 a.m. to 8 a.m., the number of passengers fell considerably.
– There was a sharp increase in the number of passengers before the figure fell considerably.
Using Relative clauses
E.g:
– The number of people who used/ using the London Underground witnessed a sharp increase from 6 a.m. to 8 a.m.
– The number of passengers, which reached a peak of 400 passengers at 8 a.m., fell considerably to around 190 at 10.00 a.m.
Use Subordinating Conjunctions (words like While, Although are only used with remarkably contrasting things)
Eg:
– The consumption of margarine and butter decreased over the given period while that of low fat and reduced spreads increased.
– Although butter was the most popular spread at the beginning of the period, low fat and reduced spreads became the most widely used spread in the final years.
2. The sentence structure for the chart does not change, the trend
With these types of tests, candidates should create complex sentences by:
- Using Relative clauses
- Using Subordinating Conjunctions
- Using Language of Comparison
3. Sentence structure for Process
Complex sentence – Complex sentence:
- After/ before + V-ing/clause, clause
E.g.:
After being collected and transported to factories, plastic bottles are sorted out.
Plastic bottles are collected and transported to factories before they are sorted out.
- Once/As soon as + clause, clause
E.g.:
Once the plastic bottles are compressed into blocks, they are crushed.
The plastic bottles are crushed as soon as they are compressed into blocks.
- Clause, after which + clause
E.g.:
The plastic pieces are washed, after which they pass through a specialized machine to become pellets.
- The… stage is when + clause
E.g.:
The final stage is when products such as clothes and pencils are manufactured.
Purpose structure:
- Clause + in order to/so as to + V-infinitive
E.g.:
The plastic bottles are compressed in order to form blocks.
The plastic pieces are washed so as to rid them of contaminants.
- Clause + so that + clause
E.g.:
The plastic bottles are compressed so that blocks can be formed.
The plastic pieces are washed so that contaminants can be removed.
4. Sentence Structure For Maps
Complex sentence – Complex sentence:
- Clause + with + noun/noun phrase + V-ing
E.g.:
The North-Eastern corner of the village has completely transformed with sporting facilities replacing the farmland and forest park.
- Clause, V-ing: often used to indicate results
E.g.:
Golf and tennis facilities have been constructed, replacing the farmland and forest park.
- Where there used to be + noun/noun phrase, there + be + noun/noun phrase
E.g.:
Where there used to be shops, there are restaurants.
- Another development/transformation that takes place/occurs + be + noun phrase
E.g.:
Another transformation that has taken place is the addition of more housing facilities.
The Map format also applies purpose structures such as in order to/so as to or so that.
E.g.:
The forest park was demolished in order to make way for sporting facilities.
5. How To Describe Data
How to divide tenses in IELTS Writing Task 1
- If the year in the question comes before the current year, use the past tense.
- If the year in the text comes after the current year, use future tenses.
- If the question does not state the year, use the present simple.
- With a format with many timelines, extending from a time in the past to a time in the future, candidates may have to use the past, present, and future tenses.
E.g.:
The graph shows the change of X in the period 1990 – 2030. Candidates should separate the period into segments as follows:
1990 – 2020: Use the Past tense
In 2021: Use Present Tense
2022 – 2030: Use the Future tense
Relative Clause
A relative clause is a subordinate clause that modifies the noun that precedes it. Relative clauses begin with the relative pronouns who, whom, which, whose, that, or the relative adverbs when, where, why.
Relative clauses are divided into two types:
- Defining relative clause:
– A clause is used to identify the noun that comes before it.
– It is a necessary clause for the meaning of a sentence; without it, the sentence would not be meaningful.
E.g.:
The amount of fish which was consumed slightly over the given period.
- Non-defining relative clause:
– A clause that gives more information about a person, thing or thing.
– Not necessarily in the sentence; without it, the sentence still has enough meaning.
– Delimited with the main clause by commas (,) or dashes (-).
E.g.:
The consumption of beef, which hardly changed between 1984 and 1994, dropped considerably to around 120 grams in 2004.
Passive Sentence Passive Sentence
Passive sentences are often used in the form of Process and Map lessons.
S + be + Vpp (+ by sb/sth)
II. Some Vocabulary Related to Writing Task 1
1. Vocabulary For Bar Chart
The Bar Chart post format with two or more timelines also applies Language of Change. In addition, writers need to use Language of Comparison to describe comparisons, including the following comparison structures: Comparative, Superlative, Comparison of Equality, Multiple Numbers Comparison.
Comparative and Superlative
Some special cases
| Adjective | Comparative | Superlative |
| good bad far much little | better worse farther/further more less | (the) best (the) worst (the) farthest/furthest (the) most (the) least |
The words more, less, few, or (the) most, least, fewest can also be used with nouns or noun phrases to make comparisons.
E.g.:
- The French spent less money on cars than the British.
- The French spent the least amount of money on cameras.
Comparison of Equality
- S + V + as + adj/adv + as + Noun phrase/clause
E.g.:
– The amount of money spent on groceries in country A was as much as the figure for country B.
– The citizens in country A worked as hard as those in country B.
– The revenue of company C is still as high as it was three years ago.
- S + V + as + many/much/little/few + Noun (phrase) + as + Noun phrase/clause
E.g.:
– The citizens in country A had as much leisure time as those in country B.
– There were as many employees in company C as there were in company D.
Multiple Numbers Comparison
- S + V + number (half, twice, triple, four times) + as + much/many + (Noun/noun phrase) + as + Noun phrase.
E.g.:
The spending on cameras in France was almost twice as much as the figure for the UK.
The salary of company C’s employees was half as much as the figure for company D.
- S + be + double/triple + Noun phrase
E.g.:
The spending on cameras in the UK was almost double the figure for France.
The salary of company E’s employees was triple the figure for company D.
The above comparisons should be combined with estimated words/phrases such as slightly, considerably, nearly, almost, nowhere near as, not quite as, not nearly as, almost as,… to increase the accuracy of the description data.
With Bar Chart, the linking phrases used for comparison are also important:
- While/whereas + clause: while
E.g.:
Company C sold 40 cars while Company D sold 120.
- Compared to/as opposed to + Noun phrase: compared to
Eg:
Company C sold 40 cars as opposed to Company D which sold 120.
2. Vocabulary For PIE Chart
To express the category and percentage of the object, candidates need to use phrases used in Writing IELTS Task 1 as follows:
- S + account for/occupy/comprise/make up/take up + (of…) + … %
E.g.:
– The amount of time spent on social media accounts for almost 30% of the total time in 2012.
– The amount of time spent on social media accounts for a smaller percentage of the total time than the figure for games in 2012.
In a pie chart, you should also use Language of Comparison like in a column chart; if there are two or more pie charts with different times, you need to use Language of Change.
3. Vocabulary For Table Format
The data table also uses Language of Comparison and Language of Change (if there are multiple timelines).
The data table is often considered a difficult test because many candidates do not know how to select important information to include in the article or will write too detailed and rambling. Therefore, before going into writing this form, do the following steps:
- If the table has two or more timelines, determine the change or trend of the item or object.
- Look at each horizontal row and mark the largest and smallest numbers, similar to the vertical rows, from which to choose about 8 outstanding numbers to include in the article.
- Compare items and objects with each other and determine the most prominent category and object.
4. Vocabulary For Process Format
Vocabulary to describe the process at the start of the process:
At the start/beginning…
To begin with,…
The process starts/ commences with…/ when…
In the first step,
The first step in the process is
The first stage in the process is
At the first stage of….
E.g.:
At the first stage of the paper recycling process, recycled paper is collected.
Next steps:
Next,…
Then…
After that,…
reward,..
As soon as……
After……..
Once……..
…, followed by…
…, after which…
The steps take place at the same time:
At the same time…
Simultaneously…
meanwhile,…
While
Thereby
End process:
At the end…
Finally,…
The process ends with…/ when…
5. Vocabulary For Maps
Direction:
– North: to the north
– South: South direction
– East: East direction
– West: to the west
Location phrases:
– In the + [direction] of: In the North of the village
– In the + [direction] corner: In the Northern corner
– To the + [direction] of: To the North of the village
– [direction] of: North of the village
– From [direction] to [direction]: From the North to the South of the village
Prepositions of position: next to, between, in front of, behind,…
Instructions On How To Write IELTS Writing Task 1 Part1
III. Experience In IELTS Writing Task 1
1. Mistakes To Avoid When Writing Task 1
Wrong unit
In IELTS Writing Task 1, to express the percentage in the test, we often use words like ‘percent,’ ‘percentage’, ‘proportion’, ‘rate’, and ‘ratio’. But many of you still do not understand how to distinguish Percent, Percentage, Proportion, Rate, and Ratio. Therefore, pay attention to the units given in the test and use appropriate vocabulary and prepositions.
2. Paraphrasing, Overview Not Clear
Paraphrasing is one of the essential skills in IELTS Writing Task 1. If you know how to paraphrase well, it will be much easier to get a high score in IELTS Writing and improve your score in Reading.
Overview is also an essential part of your answer for IELTS Writing Task 1. You need to present a clear overview of key trends, differences, or periods’ to pass. get Band 6.5+. In other words, if you do not write the Overview section clearly, you will hardly get a score of Band 6.5+ or higher.
3. Error About Tense
To avoid grammatical errors, you need to pay attention to whether timelines accompany the data displayed on the test or not to choose the correct tenses. For example, you would use the past simple when the chart shows completed data or refers to a period in the past. Some articles deal with an everyday situation where you need to use the present tense. Some lessons even include future predictions, so you should use the future simple.
4. Some Other Errors
- Write only simple sentences, not complex ones
- Do not divide into separate paragraphs, but write like a paragraph
- Write first, second… same as Task 2
- Lack of data, time
- Lack of Language of Change/Comparison
IV. How To Learn IELTS Writing Effectively And Some Sample Lessons
1. How To Learn
In IELTS Writing Task 1, we have seven main types of essay, of which there are three types of questions that you will often encounter: Bar chart, Process, Pie chart. Therefore, it is necessary to be familiar with the types of articles and have a firm grasp of the specific vocabulary and grammar of each kind of article and help you understand how to do Writing task 1.
– Planning before writing and taking advantage of the scoring structures in IELTS Writing Task 1 learned above will help you save time and get a better report.
– Instead of trying to write a complete essay, you should practice writing IELTS Writing Task 1 many times in sections in a layout for all different types of questions. As a result, you will better understand the numbers and quickly implement ideas when facing complex problems.
– Practice writing for a certain amount of time.
– For example, 40 minutes, then gradually shorten it to 20 minutes.
2. Sample References
After learning the types of essays and how to write IELTS Writing Task 1, you should refer to the IELTS Writing Task 1 samples to learn how to write the best paper and improve your writing skills. Here are some sample essays for each type of article to help you prepare for the IELTS exam to learn how to write the best essay.
Line Graph sample
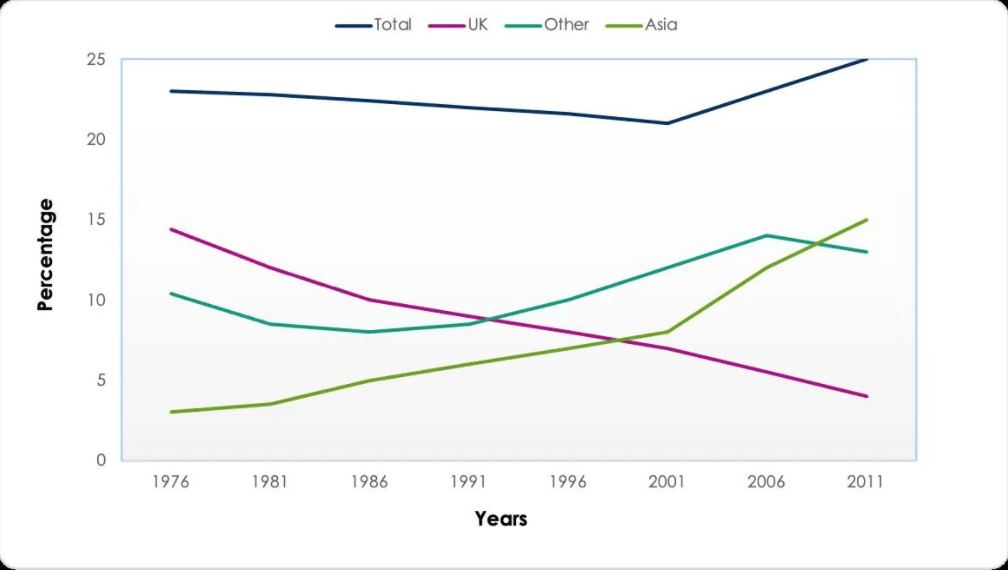
The chart below shows the percentage of Australian people who were born in different places of the world. Summarize the information by selecting and reporting the main features and make comparisons where relevant.
Sample Answer band 8.0+:
The line graph illustrates the proportion of Australians born overseas between 1976 and 2011.
Overall, it is apparent that the percentage of those born in the UK witnessed a downward trend while those from Asia and other places were on the rise. In addition, despite a moderate drop throughout most of the period, the total foreign-born population experienced a rising trend in the final decade.
The proportion of British-born Australians started at around 15%, which was followed by that of other places (about 11%) and Asia (approximately 3%). Over the following ten years, both the UK and other places saw a falling trend whereas the reverse was true for Australians of Asia descent. From 1986 to 2001, the figures for the UK and Asia continued their respective trends while the percentage of Aussies born in other locations bucked its trend and increased considerably to almost 15%. The first 25 years also recorded a drop from roughly 23% to slightly over 20% in the overseas-born population.
In the 2000s, the percentage of Australian residents born in the UK had a gradual decline before finishing at just below 5%. Meanwhile, the figures for Asia and other places enjoyed increases, going up to high points of about 15% and 13%, respectively. There was also a significant rise in the figure for the total population to a peak of 25% in 2011.
Pie Chart Sample
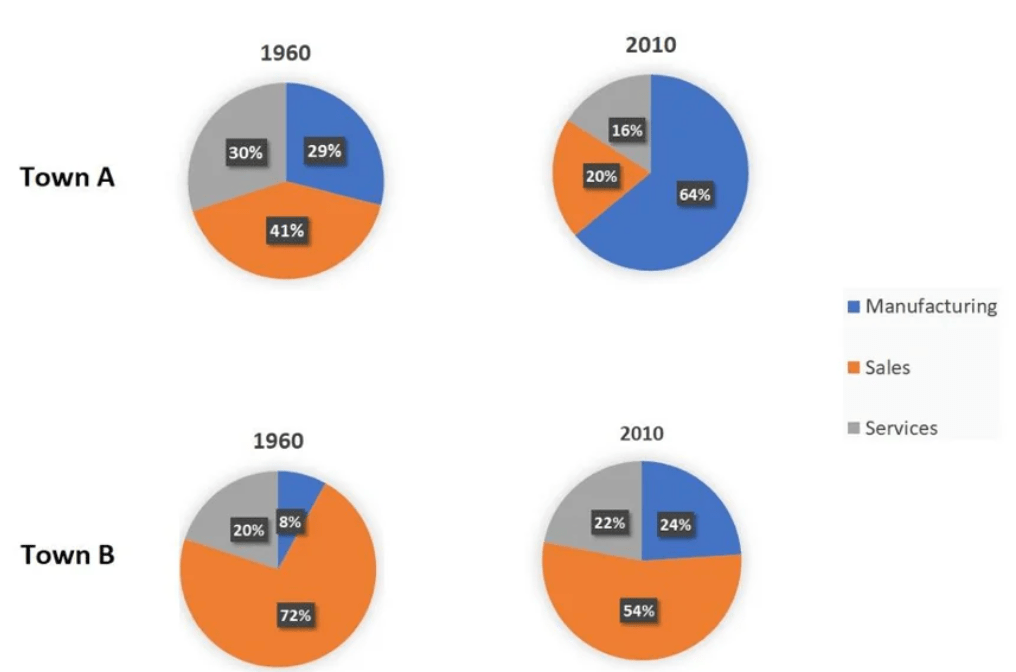
The charts show the percentage of people working in different sectors in town A and B in two years, 1960 and 2010. Summarize the information by selecting and reporting the main features and make comparisons where relevant.
Sample Answer band 8.0+:
The pie charts provide information on the proportion of people with jobs in three sectors, namely manufacturing, sales, and services, in two towns in 1960 and 2010.
Overall, it is clear that the manufacturing sector witnessed a substantial increase in both towns A and town B over the 50-year period. There was also a decline in the proportion of people working in sales in both towns.
In 1960, town A’s workforce was more evenly distributed than town B’s which was more concentrated in the sales sector. More specifically, while two-thirds of the workforce in town A work in either manufacturing or services, sales workers in town B accounted for a massive 72%. This figure was almost double the percentage of those with sales-related jobs in town A (41%).
By 2010, manufacturing had become the dominant sector in town A with a hefty 64% of workers and had tripled to nearly a quarter of the labor force in town B. In contrast, the figures for sales in town A and B dropped to 20% and 54%, respectively. In addition, while the percentage of town A’s workers with service-related jobs halved to 16% in 2010, the figure for town B rose slightly from 20% to 22%.
Mixed Chart Sample
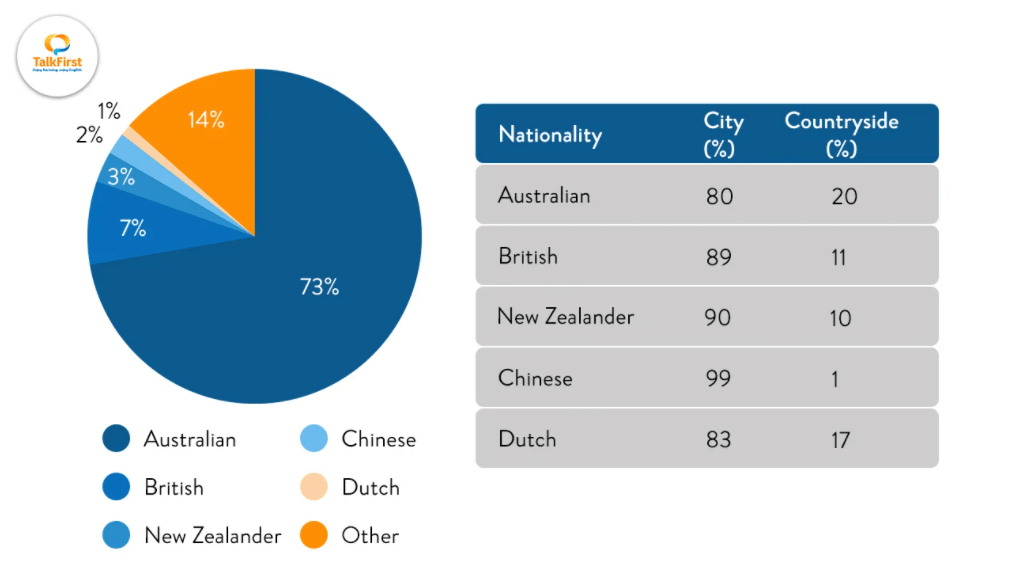
The table and pie chart give information about the population in Australia according to different nationalities and areas. Summarize the information by selecting and reporting the main features and make comparisons where relevant.
Sample Answer band 8.0+:
The pie chart illustrates the proportion of people of different nationalities in Australia while the table shows their whereabouts.
Overall, the majority of the population has Australian nationality. It is also apparent that people mostly reside in urban areas.
According to the pie chart, a hefty 73% of people living in Australia are Australians. This is followed by the figure for those who hold other nationalities (14%), which is twice as much as that for people of British origin (7%). The remaining groups only account for a minority of the population, with New Zealanders comprising 3%, the Chinese occupying 2% and the Dutch making up 1%.
Regarding the table, it is evident that an overwhelming proportion of residents in Australia are city dwellers regardless of their nationality. Almost all Chinese people, New Zealanders and British people live in cities, at 99%, 90% and 89%, respectively. Likewise, the figures for people of Australian and Dutch descent also show a preference for urban areas, with a ratio of around 8 urbanites to 2 country dwellers.